The night of 16 to 17 November was a busy one. The monitor that watches the websites of Orbitalia's clients reported that several of them had gone down at the same time, and in the end none of them had. What was failing was the server the monitor runs on. We built that monitor and we maintain it for Orbitalia, the SEO agency we work with. Here is how we spotted it, what we touched and what we changed so that a failure like this no longer fills the inbox with false alarms or sends unwanted alerts to clients.
What the monitor watches
The monitor runs on a dedicated server and does much more than check whether a site responds:
- Uptime: it requests the homepage every 5 minutes and alerts if it has been down for 15 minutes in a row.
- SEO: every night it checks each site's URLs (title, canonical, noindex, H1, schema, sitemap) and flags dangerous changes.
- Design: it opens the homepage in a real browser to catch a site served without CSS, a typical cache failure on Elementor sites.
- Updates: when core or a critical plugin is updated, it compares the key pages before and after.
- Forms: it checks that they load, that they have their styles and that the captcha returns a token.
- Email: it sends a test email from the site and checks whether it arrives.
- DNS and certificates: it alerts if the records change or a certificate is about to expire.
The night of the false alarms
Time | Event |
|---|---|
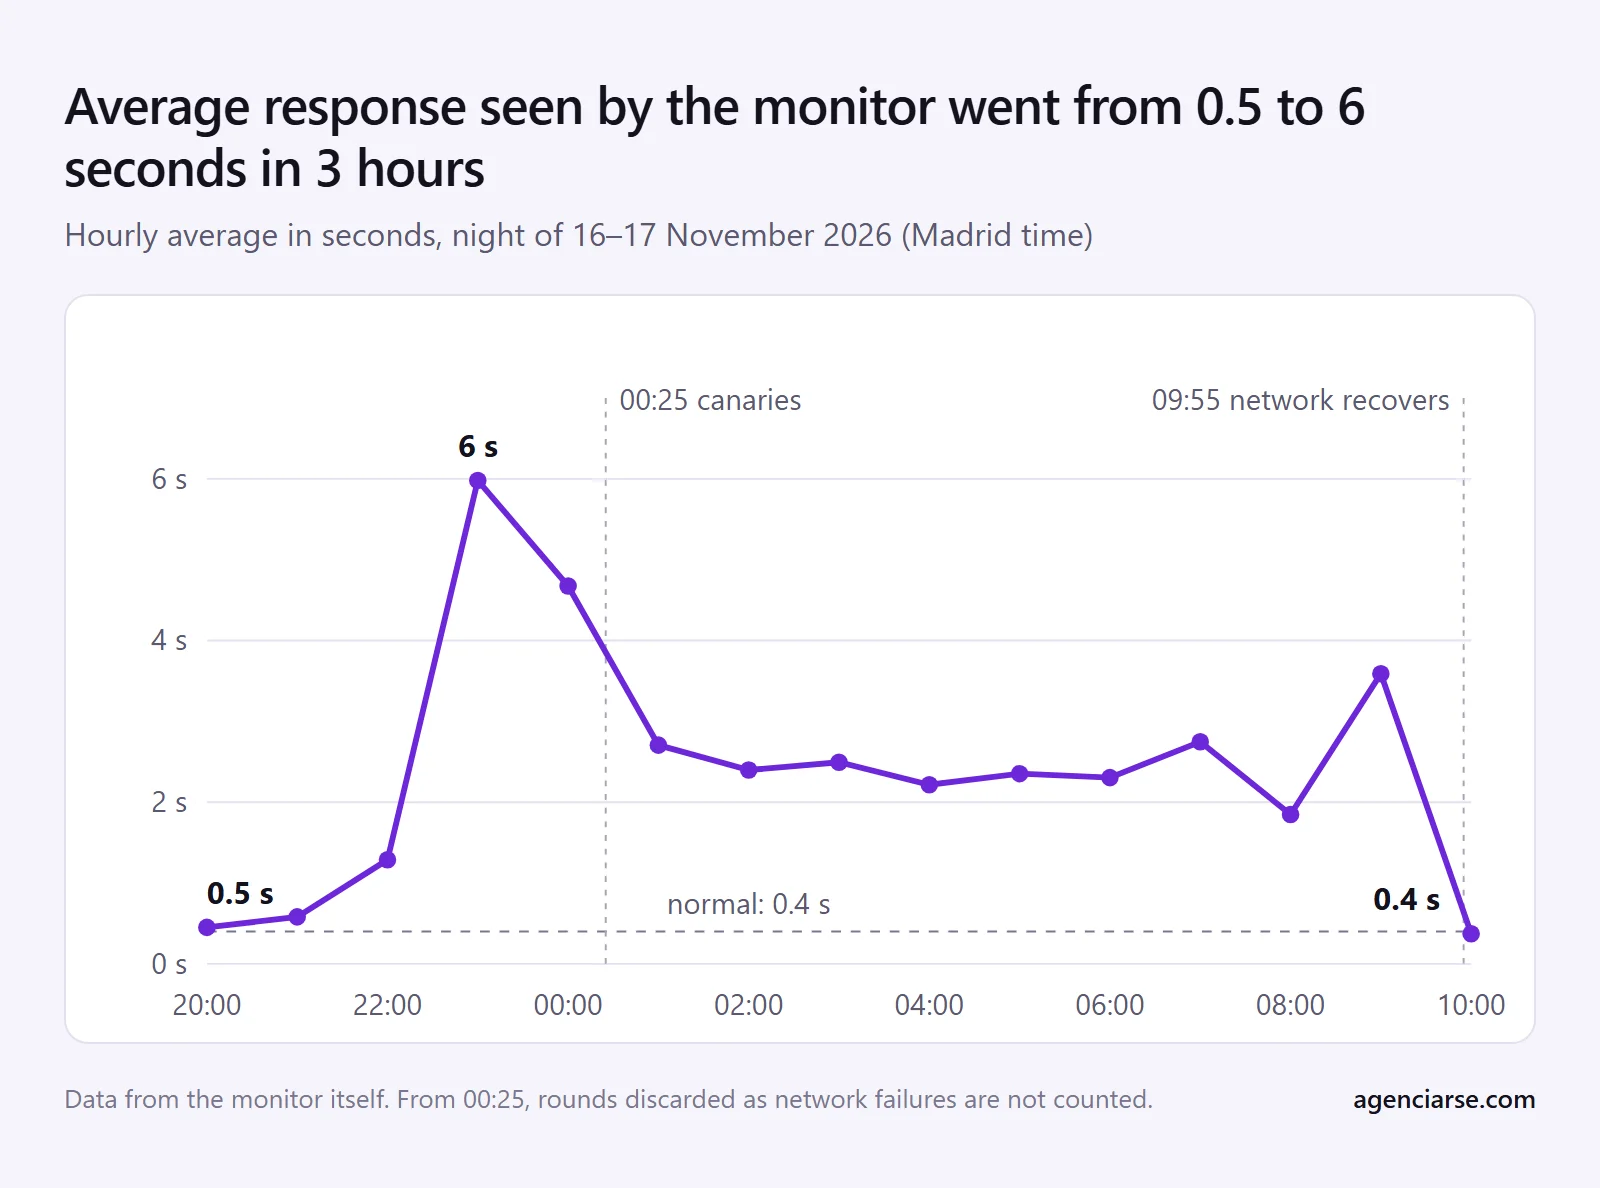
22:00 | The average response time the monitor measures goes from 0.6 to 1.3 seconds. |
23:00 to 00:20 | Half the checks get no answer: 271 out of 540 in a single hour. The monitor marks as down sites of different clients, hosted on different servers. |
00:25 | We deploy the canaries. The false outages stop. |
00:25 to 09:55 | The network is still bad. Other alerts fire now: "something broke after an update", Elementor CSS not responding, a captcha that does not load and DNS changes that were not real. |
09:55 | The network recovers on its own. |
10:00 to 12:00 | We extend the brake to every alert and add a backup DNS to the server. |
In total, 41 alerts in one night, 16 of them critical, and no client site was actually down.
What worried us most is that downtime alerts also reach the client. A client who gets an email at midnight saying their site is down, checks it, sees it working and finds out it was false, stops trusting the alert. And the day their site really goes down, they will not read it with the same urgency. That is why the false outages were the first thing we tackled, before any other alert.
How we knew it was not the sites
- Sites on servers with nothing in common were failing at the same time. A shop on its own VPS, a services site hosted in the United Kingdom, another on the agency's server. A real outage does not coincide to the minute in three unrelated places.
- From outside they loaded fine. Requested from the office they answered with a 200 in 0.2 to 0.6 seconds while the monitor was marking them as down.
- The errors were network errors, not site errors. Not a single 500 or 404:
EAI_AGAIN(DNS was not answering), connections that never got established and timeouts. The monitor was not even reaching the site to ask.
The cause was in the monitor server's own internet connection, above all in DNS: the two resolvers the provider sets by default stopped answering normally for hours. We also saw it in the sites hosted on that same server, which could not connect to their mail server.
The chart shows the average time the sites took to respond, as seen from the monitor. Outside the night of the outage, about 0.4 seconds.
The first fix: canaries and mass outage
The idea comes from coal mines, where the canary passed out before the miners did and warned them the air was bad. Here the canaries are destinations that practically never go down: Google, Cloudflare and Microsoft. In every 5-minute round the monitor checks the client sites and the 3 canaries at the same time, and only then decides.
The round is blamed on the monitor's own network if either of these two conditions is met:
- At least 2 of the 3 canaries fail. If we cannot reach Google or Cloudflare, the problem is not in anyone's website.
- Mass outage: sites on 3 or more different servers fail at once, and they fail without any HTTP response. To count servers we group the sites that share infrastructure, by client or by IP. So 10 sites of the same client behind a CDN, or 20 sites on one VPS, count as a single server. A server with many sites going down is normal and must be alerted. Three unrelated servers going down in the same minute is not.

The threshold is not a guess. Before setting it we went through 30 days of checks, about 8,600 rounds: in a normal round, at most sites on 2 different servers failed at once, and that only happened in 17 rounds. 3 or more only showed up in the network outages of 29 October, 9 November and that night.
When the round is blamed on the monitor's network, those failures are not recorded: they do not lower any client's uptime or trigger alerts. What always still counts is a 4xx or a 5xx, because that is a real response from the site.
The second fix: one shared brake for every alert
The canaries ended the false outages, but the network stayed bad for 9 more hours and the other checks kept alerting. Each one drew its own conclusion from a "not responding": the update watch took it as a broken site, the Elementor guard as missing CSS and the form test as a broken captcha.
The fix was to take the decision out of each check and put it in a single place. Every ping round records whether the monitor's network is fine or not. Before declaring anything broken, every check asks the same question: has our network failed in the last 15 minutes? If there is no recent data, it tests the canaries right then.
If the answer is yes, nothing is declared broken and everything is retried soon:
- A page that does not respond after an update does not count as a failure.
- A homepage without styles is not purged or alerted until it is seen with the network fine.
- If every Elementor CSS file comes back "no response" and none with a real status code, no incident is opened.
- A captcha that does not load, a sitemap that does not respond or an unread test email wait for the next round.
- A DNS change seen with partial answers is not compared and does not overwrite the stored records.
The third fix: a backup DNS
The brakes prevent false alerts, but they do not tackle the cause. The server resolved domains only with the two DNS servers the provider sets, and if both fail, the server has no way of knowing where each site is.
We added two more public resolvers, Cloudflare's (1.1.1.1) and Quad9's (9.9.9.9). The system asks the provider's and these at the same time, and keeps the first good answer. With everything working you do not notice it: queries still take between 1 and 43 milliseconds.

We did not take it as working without testing it. We deliberately blocked the provider's DNS for 20 seconds and requested domains the server did not have cached. They resolved in 8 to 211 milliseconds from the server itself, and in 11 to 65 from inside the monitor. The block lifted on its own after 20 seconds.
A detail for anyone using Docker: containers read the DNS configuration when they start. One that was already running keeps using only the old DNS servers until it is restarted.
What we learned
If you monitor client websites, this will save you a bad night:
- Before blaming the site, look at who else is failing at the same time. If sites on servers that share nothing go down together, the problem is on your side.
- The watchdog needs watching too. A few reliable canaries cost one request every 5 minutes and separate "a site went down" from "I lost my network".
- Decide once and ask everywhere. If each check interprets a "not responding" on its own, you fix one and the next one fires.
- Postpone, don't discard. A doubtful alert is retried when the network comes back; a real one must not be lost out of caution.
- Test the fix by breaking what it fixes. We accepted the backup DNS once we blocked the main one and saw domains still resolving.
Someone from outside also watches the monitor: UptimeRobot checks the server and each of the tools, so if the monitor goes down completely we find out anyway. That night it did not fire, and that was correct: the server was responding, what was failing was its internet connection. That is why the canaries were needed.
Want something like this for your websites?
We can help you in two ways:
- We build your own monitoring and alerting system, for your websites or for your business: what to watch, how often, who to alert and how to keep it from firing falsely. It is custom software, like the one we built for Orbitalia.
- We take care of your WordPress maintenance with monitoring included. If something breaks, we find out first and fix it; you only hear from us when there is really something to tell.
Tell us how many websites you have and how you monitor them today, and we will suggest the option that fits best.